Atomic-scale transition
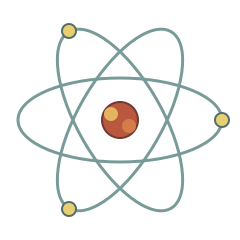
An atomic-scale transition is a rapid change in the energy state of an atom, often occurring in extremely short intervals.
How big is it?
1 fs
Time · reference interval

A little perspective
Caesium-133 clock transition is about 109,000 times larger on this measurement.
Caesium-133 clock transition: The caesium-133 clock transition is the specific change in energy state of a caesium-133 atom that defines the duration of one second in the International System of Units.
Measurements, assumptions & sources +
Atomic-scale transition
A chosen femtosecond process interval; real transitions span many timescales.
Defined examples — our methodology
The marked time is calibrated. Unmeasured illustration details are representative.
Caesium-133 clock transition
The SI second is defined from exactly 9,192,631,770 periods of the unperturbed caesium-133 ground-state hyperfine transition. Period and photon energy here are derived from that exact frequency.
BIPM — The International System of Units
The marked one transition period is calibrated. Unmeasured illustration details are representative.
Change your perspective
Put it next to…
Choose a suggestion to redraw the comparison, or open its page to learn what it is.
Why this measurement?
Why we use 1 fs
For comparison, this page uses time. This is labelled reference interval: an explicit comparison model rather than a claim that every example has the same value.
A chosen femtosecond process interval; real transitions span many timescales.
The identifying illustration and the numerical comparison remain separate. How calibrated comparisons work →
Recorded properties
Atomic-scale transition dimensions and measurements
| Property | Selected value | Recorded range | Basis |
|---|---|---|---|
| 1 fs | Not recorded | reference interval |
Around this scale
Go smaller. Go bigger.
These links use compatible time records, ordered around the selected value.
 Nearest lower value · TimeTop quark lifetime5 × 10⁻²⁵ sThis is the average time a top quark exists before it decays into other particles.Nearest higher value · Fundamental physicsCaesium-133 clock transition108.8 psThe caesium-133 clock transition is the specific change in energy state of a caesium-133 atom that defines the duration of one second in the International System of Units.
Sources and method
Want to check the number?
The source records and measurement method remain available for inspection.
There’s always another scale
Follow your curiosity.
 TimeBlink of an eye150 msA blink of an eye is the quick closing and opening of the eyelid, usually happening involuntarily.TimeHuman lifetime80 yearsA human lifetime is the span from a person's birth to their death.
 TimeAge of Earth4.54 GyrThe age of Earth is the time that has passed since the planet formed from the solar nebula.TimeAge of the universe13.8 GyrThe age of the universe is the time since the Big Bang, marking the beginning of cosmic expansion.Fundamental physicsCaesium-133 clock transition108.8 psThe caesium-133 clock transition is the specific change in energy state of a caesium-133 atom that defines the duration of one second in the International System of Units.TimeTop quark lifetime5 × 10⁻²⁵ sThis is the average time a top quark exists before it decays into other particles.TimeMuon lifetime2.197 µsMuon lifetime is the average time a free muon exists before decaying into other particles, such as an electron and neutrinos.TimeCamera flash1 msA camera flash is a brief, intense burst of light used to illuminate a scene for photography.