
100 hectare farm
A farm is land used for growing crops or raising animals for food production.
How big is it?
1 km² · area
Also 247.1 acres
Area · example
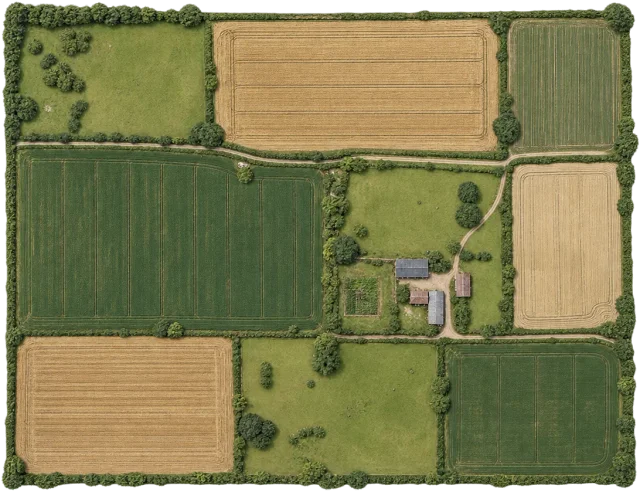
A little perspective
100 hectare farm vs Central Park: area comparison
Central Park has about 3.41 times the area of a 100 hectare farm.
A farm is land used for growing crops or raising animals for food production.
Too small to see at this scale. The ring marks its true-scale position, not its area. The shape has not been enlarged.
Central Park is a large public park in the centre of Manhattan, New York City.
Too small to see at this scale. The ring marks its true-scale position, not its area. The shape has not been enlarged.
Measurements, assumptions & sources +
100 hectare farm
Area: 1 km²; example.
Defined 1 × 1 km equal-area rectangle. A teaching example, not a named place or actual boundary.
Defined examples — our methodology
The marked area is calibrated. Unmeasured illustration details are representative.
Central Park
Area: 3.41 km²; rounded geography model.
A rounded 3.41 km² park-area anchor. The diagram is an equal-area shape, not a map.
Defined examples — our methodology
The marked area is calibrated. Unmeasured illustration details are representative.
Use the visual comparison to explore its scale, then check the measurements and sources.
Change your perspective
Put it next to…
Choose a suggestion to redraw the comparison, or open its page to learn what it is.
Why this measurement?
Why we use 1 km²
We compare the area of a 100 hectare farm. This is an illustrative comparison value, not a claim that every example is the same.
Defined 1 × 1 km equal-area rectangle. A teaching example, not a named place or actual boundary.
The picture identifies the subject; the diagram compares the recorded values. How calibrated comparisons work →
Recorded properties
Dimensions and measurements
| Property | Selected value | Recorded range | Basis |
|---|---|---|---|
| 1 km² | Not recorded | example | |
| 1 km | Not recorded | example | |
| 1 km | Not recorded | example |
Around this scale
Explore nearby values.
Compare examples with lower, similar and higher values. Each card names the measurement being compared.
Sources and method
Want to check the number?
The source records and measurement method remain available for inspection.
There’s always another scale
Follow your curiosity.
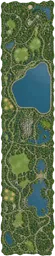 PlacesCentral Park3.41 km²Central Park is a large public park in the centre of Manhattan, New York City.
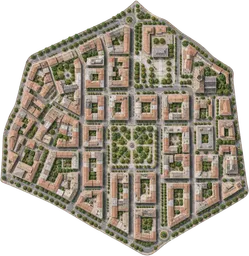 Places4 km² district4 km²A district is an administrative or informally defined part of a town, city or wider region.
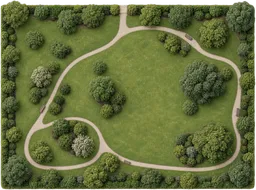 Places10 hectare park100,000 m²A park is a green space set aside for public recreation and relaxation.
 Places25 km² woodland25 km²A woodland is a tract of land dominated by trees and shrubs, supporting a variety of plant and animal life.
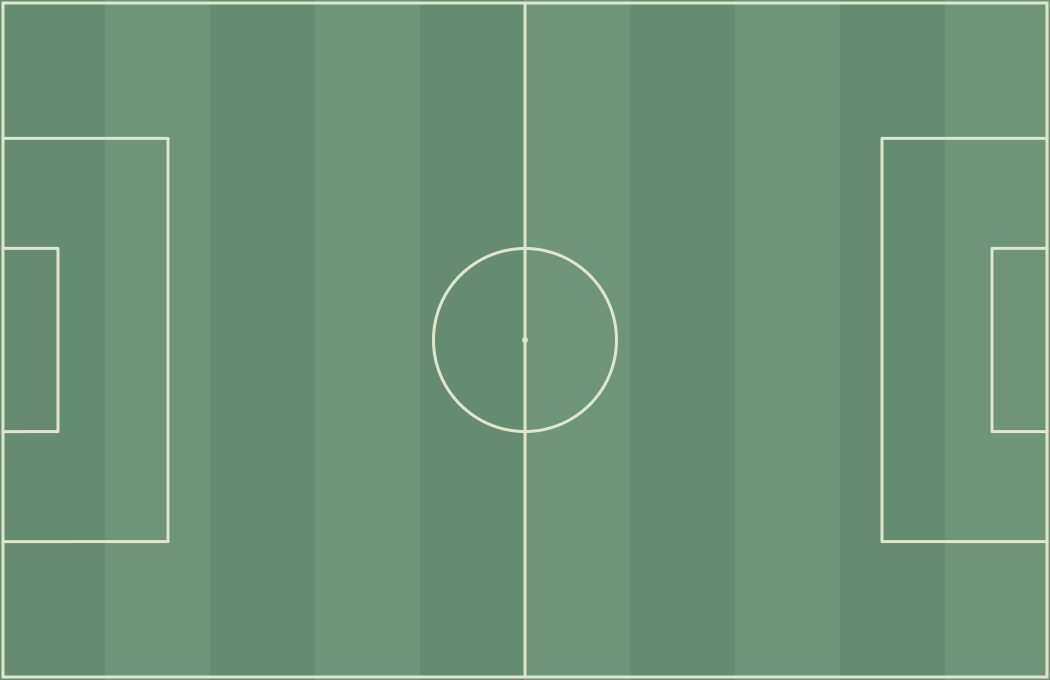 SportFootball pitch105 mA football pitch is the marked rectangular playing surface used for association football.
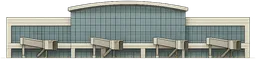 Built worldAirport terminal building100 mAn airport terminal building is a multi-storey structure where passengers board, disembark, and transfer between aircraft and ground transport.
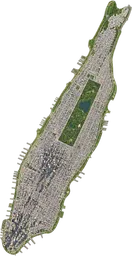 PlacesManhattan59.1 km²Manhattan is an island and borough of New York City, known as a major centre for finance, culture and media.
 Built world3 km runway3 kmA runway is a paved strip at an airport where aircraft take off and land.