
Bluetooth beacon average draw
Bluetooth beacon average draw is the average electrical power used by a Bluetooth beacon while intermittently transmitting signals.
How big is it?
100 µW · average electrical draw
Average electrical draw · representative
Typical recorded range: 10 µW to 10 mW.

A little perspective
Bluetooth beacon average draw vs Quartz watch: power comparison
The average electrical draw of a Bluetooth beacon is about 10 times the power of a quartz watch.
ENERGY EACH SECOND
Bluetooth beacon average draw is the average electrical power used by a Bluetooth beacon while intermittently transmitting signals.
The average electrical power consumed by a quartz wristwatch during operation.
Measurements, assumptions & sources +
Bluetooth beacon average draw
Average electrical draw: 100 µW; representative; range 10 µW–10 mW.
A representative 0.1 mW time-averaged draw for a low-duty-cycle Bluetooth beacon. Advertising interval, transmit power, sleep current and supply losses dominate the result.
Defined examples — our methodology
The marked average electrical draw is calibrated. Unmeasured illustration details are representative.
Quartz watch
Power: 10 µW; example.
A chosen 10 µW average draw; design and functions affect consumption.
Defined examples — our methodology
The marked power is calibrated. Unmeasured illustration details are representative.
Use the visual comparison to explore its scale, then check the measurements and sources.
Change your perspective
Put it next to…
Choose a suggestion to redraw the comparison, or open its page to learn what it is.
Why this measurement?
Why we use 100 µW
We compare the average electrical draw of a Bluetooth beacon. This is a representative comparison value; individual specimens or conditions can vary. The recorded range is 10 µW to 10 mW.
A representative 0.1 mW time-averaged draw for a low-duty-cycle Bluetooth beacon. Advertising interval, transmit power, sleep current and supply losses dominate the result.
The picture identifies the subject; the diagram compares the recorded values. How calibrated comparisons work →
Recorded properties
Dimensions and measurements
| Property | Selected value | Recorded range | Basis |
|---|---|---|---|
| 100 µW | 10 µW to 10 mW | representative |
Around this scale
Explore nearby values.
Compare examples with lower, similar and higher values. Each card names the measurement being compared.
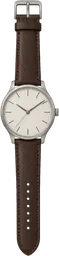 Nearest lower valuePower and outputQuartz watch10 µWPowerThe average electrical power consumed by a quartz wristwatch during operation.Nearest higher valuePower and outputHearing aid average draw1 mWAverage electrical drawHearing aid average draw is the typical electrical power consumed by a hearing aid during normal operation.
Sources and method
Want to check the number?
The source records and measurement method remain available for inspection.
There’s always another scale
Follow your curiosity.
PowerQuartz watch10 µWThe average electrical power consumed by a quartz wristwatch during operation.PowerSingle-mode laser pointer optical output5 mWSingle-mode laser pointer optical output is the continuous visible light power emitted by a standard handheld laser pointer operating in a single spatial mode.PowerPacemaker average electrical draw10 µWPacemaker average electrical draw is the typical amount of electrical power consumed by an implanted cardiac pacemaker during operation.PowerHearing aid average draw1 mWHearing aid average draw is the typical electrical power consumed by a hearing aid during normal operation.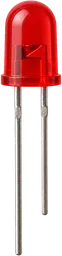 PowerIndicator LED50 mWThe electrical power used by a small light-emitting diode that indicates device status.PowerDigital wristwatch LCD draw1 µWDigital wristwatch LCD draw is the electrical power required to operate the display of a basic digital wristwatch continuously.
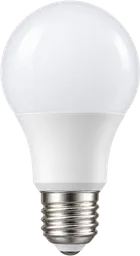 PowerLED bulb9 WThe electrical power drawn by a light-emitting diode lamp used for illumination.PowerSmartphone active electrical draw3 WSmartphone active electrical draw is the electrical power consumed by a smartphone during active use, including display, processing and wireless communication.