
Power station
The electrical power produced by a facility that generates electricity for distribution to users.
How big is it?
1 GW · power
Power · example
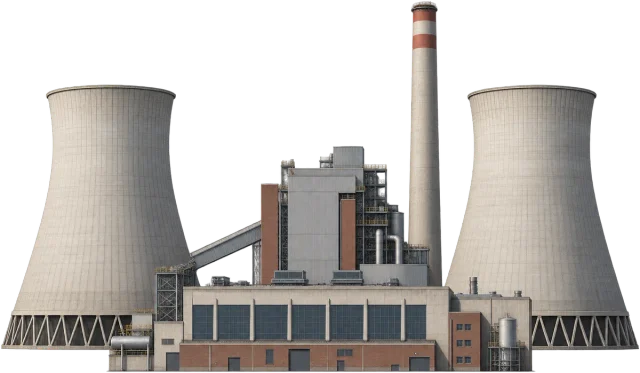
A little perspective
Power station vs Three Gorges Dam rated output: power comparison
The rated output of the Three Gorges Dam is about 22.5 times the power of a power station.
ENERGY EACH SECOND
The electrical power produced by a facility that generates electricity for distribution to users.
Three Gorges Dam rated output is the maximum electrical power the dam's generators are designed to produce.
Measurements, assumptions & sources +
Power station
Power: 1 GW; example.
A chosen 1 GW electrical output. Capacity and actual generation differ.
Defined examples — our methodology
The marked power is calibrated. Unmeasured illustration details are representative.
Three Gorges Dam rated output
Installed generating capacity: 22.5 GW; specified.
The Three Gorges hydropower station has 22.5 GW installed generating capacity. Actual output varies with water and operating conditions.
China Three Gorges Corporation — Three Gorges Project
The marked installed generating capacity is calibrated. Unmeasured illustration details are representative.
Use the visual comparison to explore its scale, then check the measurements and sources.
Change your perspective
Put it next to…
Choose a suggestion to redraw the comparison, or open its page to learn what it is.
Why this measurement?
Why we use 1 GW
We compare the power of a power station. This is an illustrative comparison value, not a claim that every example is the same.
A chosen 1 GW electrical output. Capacity and actual generation differ.
The picture identifies the subject; the diagram compares the recorded values. How calibrated comparisons work →
Recorded properties
Dimensions and measurements
| Property | Selected value | Recorded range | Basis |
|---|---|---|---|
| 1 GW | Not recorded | example |
Around this scale
Explore nearby values.
Compare examples with lower, similar and higher values. Each card names the measurement being compared.
 Nearest lower valuePower and outputContainer ship engine shaft power60 MWDefined large-engine shaft outputContainer ship engine shaft power is the mechanical power transmitted from a ship’s main engine to its propeller for movement through water.
 Nearest higher valuePower and outputSpace Shuttle main engine thermal power12 GWDefined full-power thermal scaleSpace Shuttle main engine thermal power is the rate at which heat energy is produced by the engine's combustion during operation.
Sources and method
Want to check the number?
The source records and measurement method remain available for inspection.
More ways to see it
Curated comparisons
There’s always another scale
Follow your curiosity.
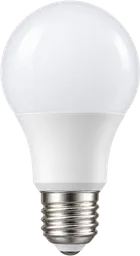 PowerLED bulb9 WThe electrical power drawn by a light-emitting diode lamp used for illumination.
 PowerElectric kettle3 kWThe electrical power used by an electric kettle to heat water.
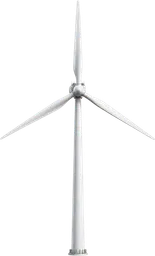 PowerWind turbine5 MWThe rated electrical power output of a wind-driven generator.
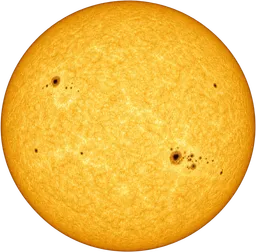 SpaceSun1,391,000 kmThe Sun is the star at the centre of the Solar System.
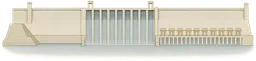 PowerThree Gorges Dam rated output22.5 GWThree Gorges Dam rated output is the maximum electrical power the dam's generators are designed to produce.
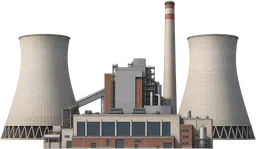 PowerLarge grid demand40 GWThe total electrical power required by all users connected to a large electricity grid at a given moment.
 PowerItaipu Dam rated output14 GWItaipu Dam rated output is the maximum electrical power the Itaipu hydroelectric dam is designed to generate under standard conditions.PowerSpace Shuttle main engine thermal power12 GWSpace Shuttle main engine thermal power is the rate at which heat energy is produced by the engine's combustion during operation.