
Lightning energy model
A lightning energy model represents the total energy released during a single lightning discharge.
How big is it?
1 GJ · energy
Energy · defined energy model

A little perspective
Lightning energy model vs Electric car battery: energy comparison
The energy of a lightning energy model is about 4.63 times the energy of an electric car battery.
ENERGY STORED OR TRANSFERRED
A lightning energy model represents the total energy released during a single lightning discharge.
Measurements, assumptions & sources +
Lightning energy model
Energy: 1 GJ; defined energy model.
A deliberately rough 1 GJ discharge model. Real flashes vary by orders of magnitude.
Defined examples — our methodology
The marked energy is calibrated. Unmeasured illustration details are representative.
Electric car battery
Energy: 216 MJ; defined energy model.
A defined 60 kWh battery; usable capacity and losses vary.
Defined examples — our methodology
The marked energy is calibrated. Unmeasured illustration details are representative.
Use the visual comparison to explore its scale, then check the measurements and sources.
Change your perspective
Put it next to…
Choose a suggestion to redraw the comparison, or open its page to learn what it is.
Why this measurement?
Why we use 1 GJ
We compare the energy of a lightning energy model. This is an illustrative comparison value, not a claim that every example is the same.
A deliberately rough 1 GJ discharge model. Real flashes vary by orders of magnitude.
The picture identifies the subject; the diagram compares the recorded values. How calibrated comparisons work →
Recorded properties
Dimensions and measurements
| Property | Selected value | Recorded range | Basis |
|---|---|---|---|
| 1 GJ | Not recorded | defined energy model |
Around this scale
Explore nearby values.
Compare examples with lower, similar and higher values. Each card names the measurement being compared.
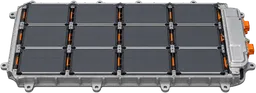 Nearest lower valueEnergyElectric car battery216 MJEnergyAn electric car battery stores energy to power an electric vehicle.
 Nearest higher valueEnergyFreight train at cruising speed1.23 GJDefined train kinetic energyThe kinetic energy of a freight train at cruising speed is the energy it has because of its motion along the tracks.
Sources and method
Want to check the number?
The source records and measurement method remain available for inspection.
More ways to see it
Curated comparisons
There’s always another scale
Follow your curiosity.
 EnergyFood kilocalorie4.184 kJA food kilocalorie is the energy needed to raise the temperature of one kilogram of water by one degree Celsius, used to express food energy.
 EnergyPhone battery54 kJA phone battery stores electrical energy to power a mobile phone.EnergyElectric car battery216 MJAn electric car battery stores energy to power an electric vehicle.
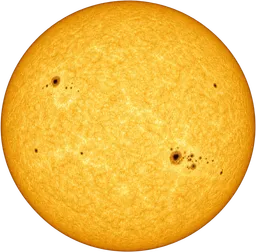 EnergyOne second of sunlight3.828 × 10¹¹ PJThe total energy emitted by the Sun in all directions over one second.EnergyFreight train at cruising speed1.23 GJThe kinetic energy of a freight train at cruising speed is the energy it has because of its motion along the tracks.
 EnergyOne tonne TNT equivalent4.184 GJOne tonne of TNT equivalent is a conventional unit of energy, defined as 4.184 gigajoules rather than by the variable yield of a particular explosive sample.
 EnergyA 10 kWh day36 MJThis is the amount of electrical energy consumed by a household over the course of one day.
 EnergyOne litre of petrol34 MJOne litre of petrol is a standard quantity of liquid fuel used in combustion engines.