
Falcon 9 liftoff thrust
Falcon 9 liftoff thrust is the total force produced by the Falcon 9 rocket's engines to lift it off the launch pad.
How big is it?
7.6 MN · liftoff thrust
Liftoff thrust · approximate
Typical recorded range: 7.4 MN to 7.8 MN.

A little perspective
Falcon 9 liftoff thrust vs Launch escape thrust of a Soyuz rocket: weight comparison
The liftoff thrust of a Falcon 9 is about 1.9 times the launch escape thrust of a Soyuz rocket.
FORCE
Falcon 9 liftoff thrust is the total force produced by the Falcon 9 rocket's engines to lift it off the launch pad.
This is the force produced by the Soyuz rocket's launch escape system to rapidly move the crew capsule away in an emergency.
Measurements, assumptions & sources +
Falcon 9 liftoff thrust
Liftoff thrust: 7.6 MN; approximate; range 7.4 MN–7.8 MN.
A representative 7.6 MN sea-level liftoff-thrust anchor for a Falcon 9. Vehicle revision, engine operating point and atmospheric conditions change the actual value.
Defined examples — our methodology
The marked liftoff thrust is calibrated. Unmeasured illustration details are representative.
Launch escape thrust of a Soyuz rocket
Force: 4 MN; approximate; range 3.8 MN–4.2 MN.
A curated launch escape thrust of a soyuz rocket comparison anchor. The representative value and any stated range preserve the backlog measurement convention; operating or experimental conditions can change real observations.
Defined examples — our methodology
The marked force is calibrated. Unmeasured illustration details are representative.
Use the visual comparison to explore its scale, then check the measurements and sources.
Change your perspective
Put it next to…
Choose a suggestion to redraw the comparison, or open its page to learn what it is.
Why this measurement?
Why we use 7.6 MN
We compare the liftoff thrust of a Falcon 9. This is an estimate; check the notes for its rounding and uncertainty. The recorded range is 7.4 MN to 7.8 MN.
A representative 7.6 MN sea-level liftoff-thrust anchor for a Falcon 9. Vehicle revision, engine operating point and atmospheric conditions change the actual value.
The picture identifies the subject; the diagram compares the recorded values. How calibrated comparisons work →
Recorded properties
Dimensions and measurements
| Property | Selected value | Recorded range | Basis |
|---|---|---|---|
| 7.6 MN | 7.4 MN to 7.8 MN | approximate |
Around this scale
Explore nearby values.
Compare examples with lower, similar and higher values. Each card names the measurement being compared.
Nearest lower valueGravity and forceLaunch escape thrust of a Soyuz rocket4 MNForceThis is the force produced by the Soyuz rocket's launch escape system to rapidly move the crew capsule away in an emergency.Nearest higher valueGravity and forceWind turbine tower base load20 MNTower-base forceThe wind turbine tower base load is the downward force exerted at the base of a wind turbine tower due to the weight of the structure and the effects of wind.Sources and method
Want to check the number?
The source records and measurement method remain available for inspection.
There’s always another scale
Follow your curiosity.
GravityLaunch escape thrust of a Soyuz rocket4 MNThis is the force produced by the Soyuz rocket's launch escape system to rapidly move the crew capsule away in an emergency.GravityWind turbine tower base load20 MNThe wind turbine tower base load is the downward force exerted at the base of a wind turbine tower due to the weight of the structure and the effects of wind.GravitySpace Shuttle liftoff thrust30.5 MNSpace Shuttle liftoff thrust is the total upward force produced by its engines and boosters to launch the shuttle from Earth.GravitySaturn V liftoff thrust34 MNSaturn V liftoff thrust is the combined force generated by the Saturn V rocket's first stage engines during launch.GravitySLS Block 1 liftoff thrust39 MNSLS Block 1 liftoff thrust is the total propulsive force produced by the Space Launch System Block 1 rocket at launch.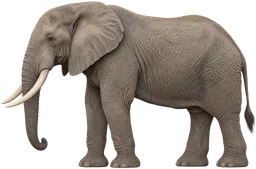 GravityWeight of a 5,000 kg elephant49.03 kNThis is the downward force exerted by gravity on an adult elephant.GravitySuspension bridge main-cable tension200 MNSuspension bridge main-cable tension is the pulling force transmitted along a main cable to support the structure and its loads.
 GravityWeight of a 1,500 kg car14.71 kNThis is the downward force exerted by gravity on a typical passenger car.